LLM Observability
Tracing, eval pipelines and drift detection for LLM and agentic systems in production - sessions, turns, steps, tool calls and subagents, with cost and quality attached to each.
Entry packageLLM Observability Starterfrom EUR 5,2001 application · up to 4 weeks from scopingWhat is includedSee the whole agent, not one call
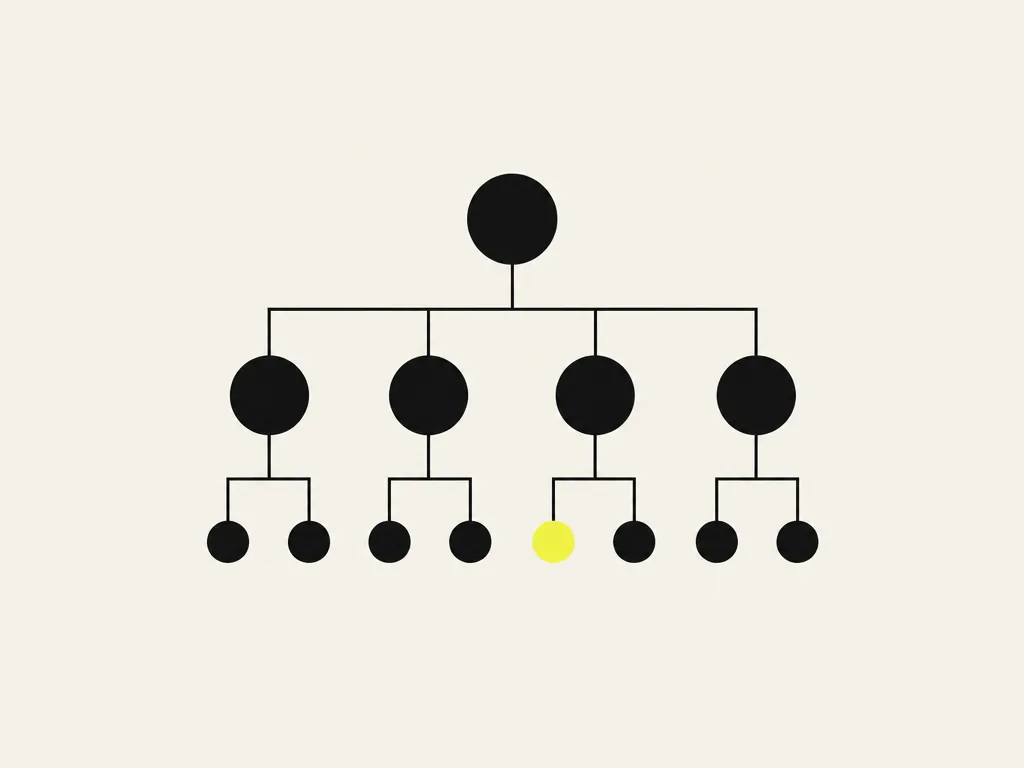
Tracing over sessions, turns, steps, tool calls and subagents, with prompt, cost, latency and version on each.
Regressions caught before merge
Eval pipelines score every prompt or model change against your test sets in CI.
Drift you notice first
Semantic, latency and cost drift detection wired into the observability stack you already run.
23Minds implements LLM observability for production systems.
Show the full summary
The service installs tracing over the entities an agentic system actually has - sessions, turns, steps, tool calls and subagents rather than isolated model calls - builds eval pipelines that score new prompt and model versions against your test sets, sets up drift detection, and integrates the signals with your existing observability stack. The test set built during an evaluation stays with you as a CI gate and a production monitor, and the team maintains and extends it after every model or prompt change. OpenTelemetry-based where possible; the service works with Datadog, Honeycomb, Grafana, Langfuse, Arize, Helicone, Braintrust, LangSmith, W&B Weave, Confident AI and Galileo, helps you pick, and at high volume shows where self-hosting beats SaaS.
What makes this service defensible.
- OpenTelemetry-based, vendor-neutral
Signals land in your existing stack; no lock-in to a tracing SaaS.
- Golden set in the starter package
Up to 100 cases, one quality and cost dashboard and an on-call runbook, in three to four weeks.
- Test set becomes a CI gate
The same thresholds block a merge and monitor production.
- Retainer in three tiers
Essential, Standard, Advanced: from monthly regression reports to an SLA on critical regressions.
The process, phase by phase.



Pick the way in that fits your budget and timing.
Every practice has a free first step, an entry package with a written deliverable and its price listed here, and a full project or retainer quoted after a first call. Once the scope is agreed, the price is fixed, with no hidden costs.
- 1Step 1 · Free
Intro call or self-assessment
60 minutes · 1 engineer · no obligation
FreeTalk to an engineerShow details
- Intro call with an engineer, or the online self-assessment
- A written next step within one business day
- No obligation and no sales deck
- Recommended2Step 2 · Entry package
LLM Observability Starter
1 application · up to 4 weeks from scoping
from EUR 5,200 netThe price is fixed once the scope is agreed on the intro call, no hidden costs; extras only from the Not included list.
Ask for this packageShow details
- Request-level tracing of one LLM application: prompt, response, latency, cost, version
- One golden set of up to 100 cases
- One quality and cost dashboard
- On-call runbook
- Not included: Observability platform licence costs, continuous evaluation retainer, instrumentation of further applications, on-call duty on our side.
- 3Step 3 · Project or retainer
Full scope, quoted after a first call
Full scope · phased delivery · quoted per phase
from EUR 1,500 net per month, quoted after a first callStart the conversationShow details
- Continuous LLM evaluation retainer in three tiers
- Essential from EUR 1,500, Standard 3,300, Advanced 6,500 per month
- Monthly regression report and alerts in your channel
The situations that bring teams to this service.
- An agent run fails and nobody can reproduce which step, tool call or subagent broke it
- Prompt and model changes ship without measurement; quality regressions are invisible
- An audit produced a good test set once and it went stale the week the model changed
Show the other problems (2)
- Latency P99 doubles overnight and nobody can pinpoint the cause
- Provider returns a wrong answer; there is no log of the request to debug from
- Engineering teams whose LLM features ship blind - no visibility into what's happening
- Teams running multi-step agents where a failure is three tool calls deep and nobody can find it
- Product leaders unable to tell whether prompt iterations improved or regressed the product
- SRE teams adding LLM services to their on-call rotation
- ML/AI engineering leads needing eval-driven prompt development
Where this goes wrong, and what we do about it.
1. Tracing built for requests, not for runsWhat stays with you: tracing over agent entities, and one real failed interaction traced end to end as proof it works
What happensStandard instrumentation records one span per HTTP call. An agent run is a session that spans turns, steps, tool calls and subagents, so the trace comes back as a flat list of requests with no parent. When the answer is wrong or the bill spikes, nobody can point at the step that caused it, because the structure that would have shown it was never recorded.
What we do about itWe instrument the entities the system actually has - session, turn, step, tool call, subagent - and attach cost, latency, model version and prompt version to each. Then we replay a real bad answer through the trace to prove the structure is usable.
2. The model changes underneath and nothing says soWhat stays with you: per-response model identifier in the trace, plus an alert that fires on divergence and has been tested
What happensA provider alias keeps its name while what it resolves to moves. Quality drifts without a deployment, so the team looks for the bug in its own change. Practitioners separate this into outcome drift, where the answer gets worse but the call still works, and execution drift, where the model starts doing something else entirely. Both are invisible unless the identifier the provider echoes back is recorded.
What we do about itWe log the model identifier returned on every response and alert when it diverges from what was requested. Version pinning goes in where the provider supports it, and where it does not, the alert is the control.
3. The dashboard shows volume and calls it healthWhat stays with you: quality metrics defined with their thresholds, on the same view as cost and latency
What happensToken counts, request rates and latency are easy to collect, so they are what gets displayed. Answer quality is hard to collect, so it is not on the board. The result is a green dashboard next to a support queue that says otherwise, and the two never meet.
What we do about itWe put a quality signal on the same board as the volume: sampled scoring against your criteria, refusal and fallback rates, and the share of sessions where a human had to step in. If a number cannot be defined well enough to alert on, it does not go on the board.
Deliverables, not deliverable-shaped slides.
- Tracing across agentic entities - sessions, turns, steps, tool calls, subagents - with prompt, response, latency, cost and version on each
- Eval pipeline with your test sets and CI-integrated regression alerts
- Your audit test set handed over as a CI merge gate and a production monitor on the same thresholds, with a routine for extending it per model or prompt change
- Drift detection on outputs (semantic drift, latency drift, cost drift)
- Dashboards: per-feature quality, per-feature cost, per-user behavior
- Runbooks for the on-call team: how to debug an LLM incident in 15 minutes
Questions procurement teams ask.
Talk to an engineer.
Describe where you are with LLM observability. A reply within one business day.