Product Analytics for AI Features
Product telemetry and analytics for AI-touched products - what to measure, what to alert on, what to put on the dashboard so product, engineering and leadership are looking at the same picture.
Entry packageAI Event Taxonomy & Dashboardsfrom EUR 4,0001 product · up to 3 weeks from scopingWhat is includedProduct questions become events
Is the AI feature used, where do users abandon, which prompt version drives revenue: each gets an event and a chart.
Three audiences, three dashboards
Product, engineering and leadership see the same data at the altitude each of them needs.
Alerts with a runbook
What fires, who gets paged and what to do, written before the first alert.
23Minds designs and implements product telemetry for AI-touched products.
Show the full summary
The service translates product questions ('is the AI feature actually used?', 'are users abandoning at the AI step?', 'which prompt version drives revenue?') into events, dashboards and alerts. Output: an event taxonomy, instrumentation across web/mobile/backend, dashboards for product/engineering/leadership and a roadmap for what to measure next.
What makes this service defensible.
- AI-specific event taxonomy
Prompt sent, output rendered, accepted, rejected, regenerated: moments generic analytics never model.
- Version tracking on every event
Prompt and model versions travel with the data, so a change can be traced to an outcome.
- Price set before work starts
Taxonomy, one instrumented layer and three dashboards; the price is fixed once the scope is agreed, three weeks.
- Quarterly review cadence in the retainer
What is measured evolves with the product instead of freezing at launch.
The process, phase by phase.

Pick the way in that fits your budget and timing.
Every practice has a free first step, an entry package with a written deliverable and its price listed here, and a full project or retainer quoted after a first call. Once the scope is agreed, the price is fixed, with no hidden costs.
- 1Step 1 · Free
Intro call or self-assessment
60 minutes · 1 engineer · no obligation
FreeTalk to an engineerShow details
- Intro call with an engineer, or the online self-assessment
- A written next step within one business day
- No obligation and no sales deck
- Recommended2Step 2 · Entry package
AI Event Taxonomy & Dashboards
1 product · up to 3 weeks from scoping
from EUR 4,000 netThe price is fixed once the scope is agreed on the intro call, no hidden costs; extras only from the Not included list.
Ask for this packageShow details
- AI-specific event taxonomy for one product
- Instrumentation in one layer: web or backend
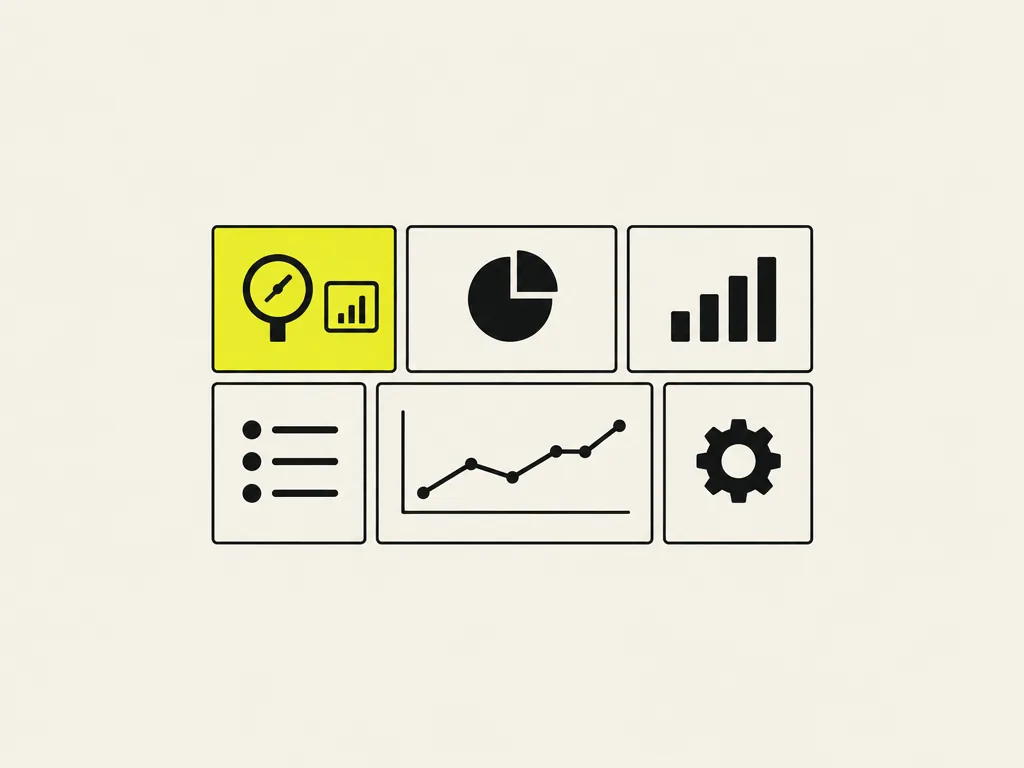
- Three dashboards: product, engineering, leadership
- Handover session
- Not included: Mobile instrumentation, historical data migration, analytics tool licences, the quarterly review cadence.
- 3Step 3 · Project or retainer
Full scope, quoted after a first call
Full scope · phased delivery · quoted per phase
from EUR 2,800 net per month, quoted after a first callStart the conversationShow details
- Full-stack instrumentation
- Alert policy
- Quarterly review cadence
The situations that bring teams to this service.
- Product is shipping AI features blind - no idea what users actually do with them
- Existing analytics tracks page views but misses AI-specific user moments (prompt edits, accept/reject, regenerate)
- Each team has its own dashboard with different numbers; leadership cannot trust any of them
Show the other problems (1)
- Alerts fire for things nobody cares about; real problems pass unnoticed
- Heads of product who cannot tell whether their AI feature is helping users
- Growth teams running A/B tests on prompt versions or AI feature rollouts
- Engineering managers building data signals into product decisions
- Founders launching AI-first products without an in-house analytics team
Where this goes wrong, and what we do about it.
1. Three teams, three definitions of the same wordWhat stays with you: metric dictionary with the definition, the query and the owner for each number
What happensProduct counts an active user one way, engineering another, leadership reads a third number from a slide. Meetings then get spent reconciling figures rather than deciding anything, and the version that wins is usually the one presented most confidently.
What we do about itWe agree the definitions first and write them down next to the query that produces each one, so the number and its meaning travel together. Where two definitions are both legitimate we keep both, named differently, rather than picking a winner quietly.
2. Events named by whoever added themWhat stays with you: event schema with the convention, the migration applied, and the list of events retired
What happensThe taxonomy grows one pull request at a time. Six months later the same event means something slightly different, a property was renamed, and a question that spans two quarters cannot be answered without a caveat nobody remembers to add.
What we do about itWe fix a naming convention, migrate the events worth keeping, and delete the ones nobody has queried. Changes to an event's meaning get a new name rather than a quiet edit, so history stays comparable.
3. Everything is measured and nothing is watchedWhat stays with you: alerting on the decision-relevant metrics, with owners, and a shorter list of dashboards that survived
What happensDashboards accumulate because building one is easy and deleting one feels rude. Nobody opens them on a normal day, so a regression is found when a customer writes in, which is the one moment the data was supposed to prevent.
What we do about itWe turn the handful of numbers that would change a decision into alerts with thresholds and an owner, and we archive the dashboards that exist only because someone once asked.
Deliverables, not deliverable-shaped slides.
- Event taxonomy (AI-specific moments: prompt sent, output rendered, accepted, rejected, regenerated, etc.)
- Instrumentation across web, mobile and backend with version tracking
- Three dashboards: product (feature health), engineering (system health), leadership (business KPIs)
- Alert policy: what fires, who gets paged, what the runbook says
- Quarterly review cadence to evolve what is measured as the product evolves
Questions procurement teams ask.
Talk to an engineer.
Describe where you are with product analytics for AI features. A reply within one business day.